Microwave those crystals

Microwaves aren’t just a quick, easy way to heat up your pizza pocket. Researchers at Khalifa University are using them to grow high-quality crystals that could power low-energy memory devices.

Creating these crystals typically involves multiple-step, high-heat processes, but this method, using microwave energy, turns the natural material molybdenum disulfide into molybdenum trioxide crystals in minutes.

The crystals can grow to almost 1 centimeter long, and the process uses up to 140 times less energy with substantially less carbon output.

Further, these crystals can be used to construct memristors (tiny electronic components that remember past activity). The devices worked reliably with only low voltage, which makes them a promising option for producing faster, energy-saving electronics.

Ultimately, this simple microwave method could pave the way for smarter, low-power tech with cheaper, greener and easier-to-produce advanced materials — a big win for both industry and the environment.

More like this: Launching medical research

Autism checks

Typically, an autism diagnosis is done through in-person communication and observation, but a new study aims to determine if diagnoses can be accurately completed using video calls.

The study, involving 39 children, compared video-based diagnoses with traditional evaluations. It was completed using two remote tools with older children who have the ability to speak in short phrases or full sentences.

The tool for phrase-level speakers worked well, but the tool for fully fluent kids was less consistent, sometimes missing or misidentifying cases.

Parents were generally in favor of the telehealth approach, but comparison between in-person and remote diagnoses disagreed about 64 percent of the time.

Still the results show promise, especially considering that many children with other conditions like ADHD are diagnosed with autism later. Telehealth could become an option for those with limited access to specialists due to location.

For now, these video-based assessments can be a helpful step forward but work best as a support tool, rather than a replacement for in-person diagnosis.

More like this: Autism diagnosis within our grasp

Is Wall Street misreading its
favorite risk metric?

For decades, the financial industry has relied on the Sharpe ratio as a benchmark for performance. It is simple, intuitive and deeply embedded in practice: higher Sharpe, better strategy.

But a new study suggests the issue is not the Sharpe ratio itself — it is how we interpret its reliability.

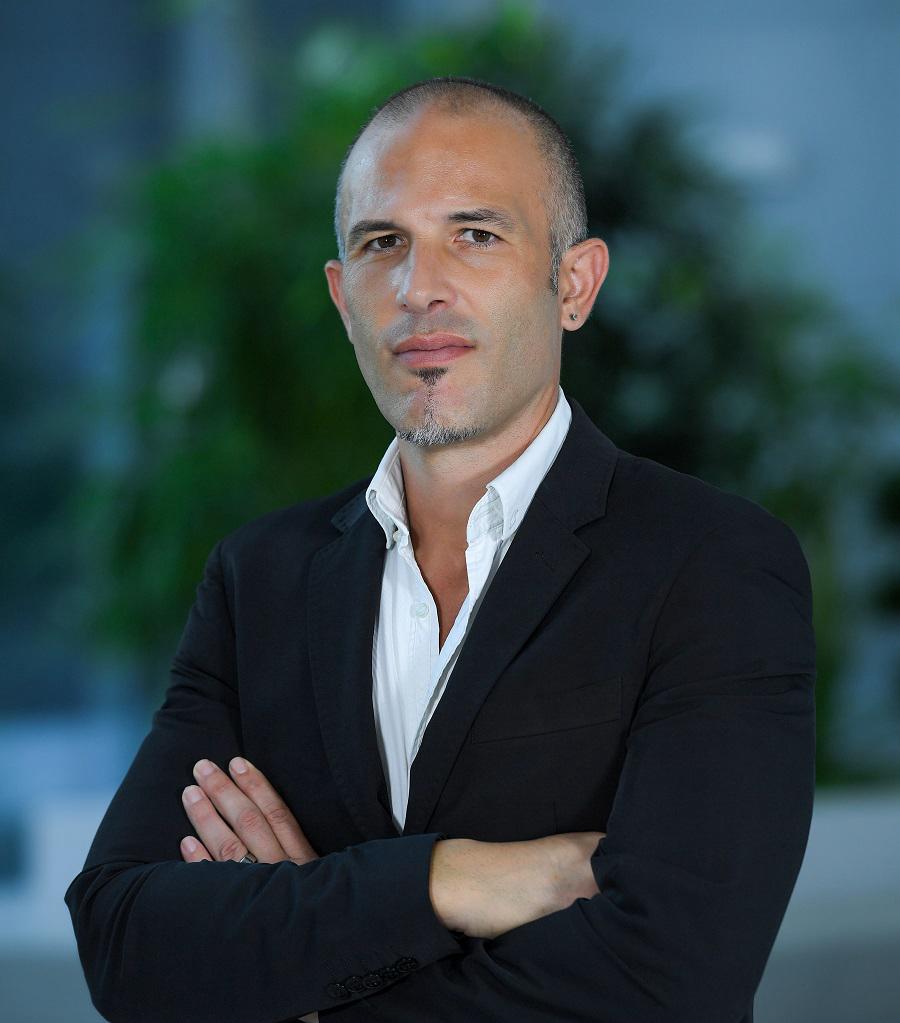
CAPTION: Emilio Porcu-spatial statistician, data scientist and  mathematics professor at Khalifa University IMAGE: Khalifa University

Emilio Porcu, a theoretical statistician and data scientist at Khalifa University, together with Marcos López de Prado and Vincent Zoonekynd of the Abu Dhabi Investment Authority and Nobel Laureate Robert Engle, argues that the Sharpe ratio remains a valid and meaningful tool — but only if it is understood within the correct probabilistic framework.

Financial markets, they note, do not behave like textbook models. Volatility clusters shift between calm and turbulence. Risk is time-varying, and expected returns can depend directly on that risk. Extreme events are not rare anomalies — they are part of the system.

Under these conditions, the classical statistical machinery used to assess Sharpe ratio uncertainty — typically based on stable, Gaussian assumptions — may no longer be appropriate.

“The problem is not the Sharpe ratio,” Porcu explains. “The problem is assuming that its uncertainty can be described in the same way across all market conditions.”

CAPTION: Marcos López de Prado-Professor of Practice in the mathematics department at Khalifa University and the Global Head of Quantitative Research and Development at the Abu Dhabi Investment Authority IMAGE: MIT Media Lab

“There are situations where the usual tools don’t just need adjustment,” Porcu says. “They are answering a different question altogether.”

The team proved a fundamental theorem that explicitly accounts for these features. Using GARCH-type models — widely used in finance to capture volatility dynamics — they derive closed-form expressions for the uncertainty of the Sharpe ratio when returns are driven by persistent and evolving risk.

Their key insight is that “Sharpe ratio inference is regime-dependent.”

In light-tailed environments, classical Gaussian approximations may still apply, although with important corrections reflecting volatility persistence and feedback effects. But in heavier-tailed regimes — where extreme events are more frequent and key moments may not exist — the entire statistical framework can shift.

The paper, submitted to Econometrica, has already attracted significant attention. A recent LinkedIn post discussing the work generated hundreds of comments and thousands of downloads within days.

For Marcos López de Prado, the implications are practical and immediate: “Investors often treat high Sharpe ratios as evidence of skill,” he says. “But that conclusion depends on how uncertainty is measured. Our results show precisely when classical inference is valid, when it needs correction, and when it breaks down entirely. If volatility dynamics and tail risk are ignored, Sharpe ratios can be misinterpreted — sometimes severely.”

IMAGE: Shutterstock

Rather than undermining the Sharpe ratio, the research places it on firmer ground. It shows that the metric remains meaningful, but only when its statistical context is properly specified.

The takeaway is subtle, but consequential: The question is not whether the Sharpe ratio is right or wrong.

The question is: in which probabilistic regime are you using it?

More like this: What’s chaining block chain?

Google Earth, human organ style

Have you ever been playing around with Google Earth just to see if your childhood home is still standing?

Researchers from University College London and the European Synchrotron Radiation Facility created something similar, but for human organs — not to make sure they’re still there, but to explore them on an unprecedented scale. And anyone can use it.

Inspired by structural lung damage resulting from SARS-CoV-2 and the lack of imaging to help researchers understand how this happens, the team created a database of 3D organ imaging called the Human Organ Atlas. Users can zoom in to view the organ at a near cellular level, no cuts required.

This online library is free to use and contains 3D scans of real human organs. It allows an immersive learning experience for students and researchers alike.
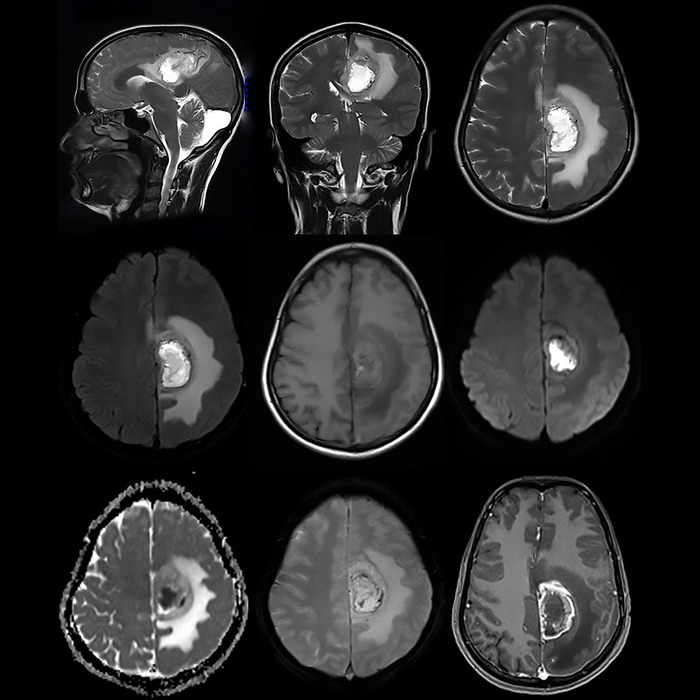
CAPTION: Glioblastoma MRI Image IMAGE: Shutterstock
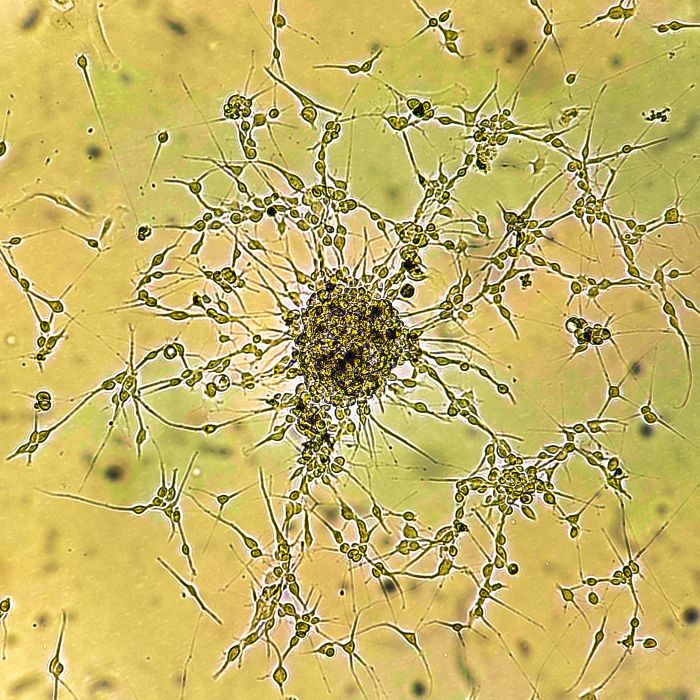
CAPTION: Glioblastoma cell culture IMAGE: Shutterstock

The tool can offer insight into disease pathology to help to build better treatments and medicines and a completely immersive anatomy lesson. It is also expected to contribute greatly to the development of AI medical systems.

Three-D organ scanning has been around for some time but many people were frustrated to zoom in to find blurry images that make fine details difficult to see. Additionally, tissue samples from organs in detail could be viewed under a microscope, but there was no way to view the organs and the tissue cells synchronously. Now both can be studied as a complete system.

The atlas was built using scanned organs from autopsies and a synchrotron (particle accelerator).

A synchrotron, roughly the size of a football stadium, “accelerates electrons very, very fast. And as these electrons are bent with magnets, they give off X-rays. And it’s these X-rays that we’re using for imaging,” Claire Walsh, lead author on the paper and director of the Human Organ Atlas Hub, tells Science Friday.


Currently we work on isolated organs, but in the future, we expect to develop the technique to be able to image complete human bodies with a resolution 10 to 20 times higher than what is possible today. Such data could transform how anatomy is studied and understood.”

Paul Tafforeau, Beamline scientist, European Synchrotron Radiation Facility


The scanning technique called hierarchical phase-contrast tomography (HiP-CT), was developed in 2021 by Walsh and her team. It scanned at about 20 microns per voxel — that’s roughly thinner than a human hair. The scans are 100 billion times brighter than conventional hospital CT scanners.

There are currently 62 organs from 12 organ types in the atlas: the brain, heart, lung, kidney, liver, colon, spleen, placenta, uterus, prostate, testis and eye. These organs offer insight into conditions such as hypertension, cancer, damage from COVID-19 and rarer disorders like Dandy-Walker Syndrome.

The world-wide usable atlas offers downloadable datasets (in multiple resolutions), tutorials and software tools for analysis, ongoing data additions and interactive browser-based visualization.

This level of biomedical imaging has been a goal for decades, and it was declared officially a functional whole-organ imaging technique in 2021. The online Human Organ Atlas was launched for all users, whether you’re a researcher, student or just an interested individual, in March 2026.

More like this: Teamwork makes the dreamwork

Contrails, take a hike

When you’re looking up at the sky to observe the jet you heard flying overhead, you’ll often notice the wispy, white lines it leaves behind. What you may not know is that those white lines, known as contrails, are aviation’s biggest contributor to climate damage. The good news is that fixing it might be simple.

A new study published in Nature Communications indicates that making small detours around parts of the sky where those contrails form could be the solution.

Smarter flight paths may make the flights slightly longer, which uses more fuel, but it’s only minimal. The tradeoff: There will be far less heat trapped without the contrails.

Under the Paris Agreement, the world aims to keep the global temperature increase under 1.5 degrees, pre-industrial revolution, 2 degrees at the most. But we’ve already spent far too much of that allowance and we will soon be over target.

If we get started soon (by at least 2035), we could save 9 percent of the remaining budget by 2050. This means instead of reducing emissions, we stop adding heat right now.

More like this: Send it back